6 Tips to Checking for Burst Pipes
Review of the Layout:
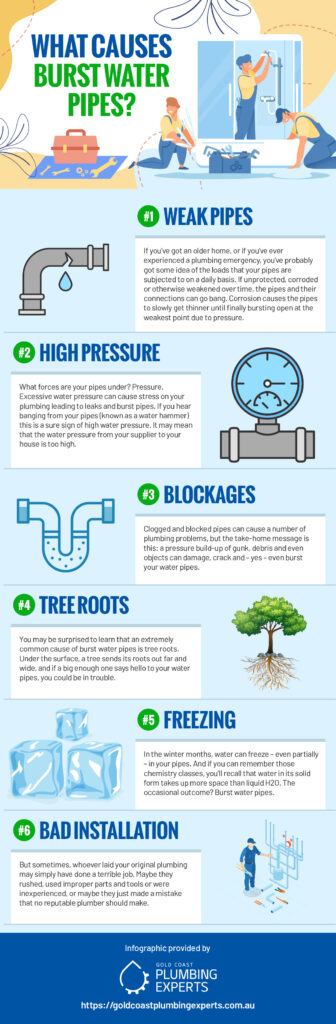
Top notch visualization on this infographic. A consistent style with strong color highlights to draw the readers eye to key information while not hiding behind hazy coloring is great. I also like the varied layout of each fact while remaining consistent in the presentation.
Review of the Content:
Longer explanations can sometimes be valuable when learning how and where to look for issues. Just a few short sentences about each topic is all that is necessary to get across each idea, but they provide information that can prove valuable in a pinch. The typical issues are highlighted here but also something like tree roots or high pressure is covered which can be often forgotten in frantic situations. These are highlighted well in this handy infographic.
Final Verdict:
Wonderful job on the entire package. The content is covered succinctly while providing plenty of information to be useful. The layout itself stays out of the way of the information and keeps the entire flow consistent, just as hopefully your pipes will be once you read all the infographic has to offer.
Source: https://goldcoastplumbingexperts.com.au/plumbing/common-causes-of-burst-water-pipes/
Score: 4.5/5